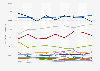
Wheat consumption in Chile amounted to 2.55 million metric tons in 2022, representing a decrease of 1.9 percent compared to the previous year. For 2023, it was expected to reach 2.63 million metric tons.
Consumption volume of wheat in Chile from 2010 to 2023* (in 1,000 metric tons)
Basic Account
Get to know the platform
You only have access to basic statistics.
This statistic is not included in your account.
Starter Account
The ideal entry-level account for individual users
- Instant access to 1m statistics
- Download in XLS, PDF & PNG format
- Detailed references
$199 USD / Month *
Professional Account
Full access
Business Solutions including all features.
* Prices do not include sales tax.
Other statistics that may interest you Grain market in Ukraine
Overview
8
- Premium Statistic Global leading wheat producing countries 2016/2017- 2023/24
- Premium Statistic Corn production worldwide 2023/2024, by country
- Premium Statistic Barley production worldwide 2023/24, by country
- Premium Statistic Agricultural export value from Ukraine 2017-2023
- Premium Statistic Agricultural export value from Ukraine 2023, by region
- Basic Statistic Agricultural export value from Ukraine to the EU 2015-2023
- Premium Statistic Ukraine: leading food export products 2022
- Basic Statistic Cereal export value from Ukraine 2022, by country
Export trade
8
- Premium Statistic Wheat, flour, and wheat products export volume in Ukraine 2014/15-2024/25
- Premium Statistic Wheat export value from Ukraine 2023, by country
- Premium Statistic Wheat export volume from Ukraine biannual 2023-2024, by country
- Basic Statistic Maize export value in Ukraine 2013-2023
- Basic Statistic Maize export value in Ukraine 2023, by country
- Premium Statistic Barley exports in Ukraine 2017-2025
- Premium Statistic Barley export volume in Ukraine 2022, by country
- Premium Statistic Coarse grain exports in Ukraine 2018/19-2022/23
Ukrainian grain imports in Central and Eastern Europe
8
- Premium Statistic Import of cereals from Ukraine in Romania 2010-2022
- Premium Statistic Cereal imports from Ukraine to Poland 2015-2023
- Premium Statistic Cereal imports from Ukraine to Poland 2022-2023, by type
- Basic Statistic Opinion on duty-free import of cheaper agricultural products in Poland 2023
- Basic Statistic Ban support on the import of grain from Ukraine to Poland and CEE 2023
- Premium Statistic Value of cereal imports in Hungary 2023, by country
- Premium Statistic Grain import volume from Ukraine to Slovakia 2022, by type
- Premium Statistic Grain import value from Ukraine to Slovakia 2022, by type
Black Sea Grain Initiative
6
- Premium Statistic Ukrainian agricultural exports via the Black Sea 2022-2023, by product
- Premium Statistic Ukrainian agricultural exports via the Black Sea 2023, by product
- Premium Statistic Ukrainian grain export volume via the Black Sea 2022-2023, selected country
- Premium Statistic Ukrainian grain export share via the Black Sea 2023, by country income
- Basic Statistic Ukrainian wheat export volume share 2023, by country development status
- Premium Statistic Cargo ship departures from Ukraine weekly 2022
Production
6
- Premium Statistic Agricultural crop production in Ukraine 2012-2023, by type
- Premium Statistic Grain production in Ukraine 2021/22-2024/25, by type
- Premium Statistic Wheat production in Ukraine 2017-2025
- Premium Statistic Corn production in Ukraine 2017-2025
- Premium Statistic Barley production in Ukraine 2017-2025
- Premium Statistic Area harvested in Ukraine 2021/2022-2023/2024, by crop
Consumption
4
Further related statistics
10
- Total U.S. wheat area planted and harvested 2001-2023
- Soft drinks: Consumption of carbonated drinks in the United Kingdom 2013-2022
- Crop values in the United States 2015-2020
- Coal consumption in South Africa 1998-2022
- Import volume of cobalt in the U.S. 2010-2023
- Area of corn for grain harvested in the U.S. 2001-2023
- Corn for grain production in the U.S. 2001-2023
- Primary energy consumption in Brazil 2009-2022
- Primary energy consumption in Germany 1998-2022
- Primary energy consumption in Asia Pacific 2022
Further Content: You might find this interesting as well
Statistics
- Total U.S. wheat area planted and harvested 2001-2023
- Soft drinks: Consumption of carbonated drinks in the United Kingdom 2013-2022
- Crop values in the United States 2015-2020
- Coal consumption in South Africa 1998-2022
- Import volume of cobalt in the U.S. 2010-2023
- Area of corn for grain harvested in the U.S. 2001-2023
- Corn for grain production in the U.S. 2001-2023
- Primary energy consumption in Brazil 2009-2022
- Primary energy consumption in Germany 1998-2022
- Primary energy consumption in Asia Pacific 2022
Index Mundi. (February 2, 2024). Consumption volume of wheat in Chile from 2010 to 2023* (in 1,000 metric tons) [Graph]. In Statista. Retrieved June 14, 2024, from https://www.statista.com/statistics/881164/chile-wheat-consumption/
Index Mundi. "Consumption volume of wheat in Chile from 2010 to 2023* (in 1,000 metric tons)." Chart. February 2, 2024. Statista. Accessed June 14, 2024. https://www.statista.com/statistics/881164/chile-wheat-consumption/
Index Mundi. (2024). Consumption volume of wheat in Chile from 2010 to 2023* (in 1,000 metric tons). Statista. Statista Inc.. Accessed: June 14, 2024. https://www.statista.com/statistics/881164/chile-wheat-consumption/
Index Mundi. "Consumption Volume of Wheat in Chile from 2010 to 2023* (in 1,000 Metric Tons)." Statista, Statista Inc., 2 Feb 2024, https://www.statista.com/statistics/881164/chile-wheat-consumption/
Index Mundi, Consumption volume of wheat in Chile from 2010 to 2023* (in 1,000 metric tons) Statista, https://www.statista.com/statistics/881164/chile-wheat-consumption/ (last visited June 14, 2024)
Consumption volume of wheat in Chile from 2010 to 2023* (in 1,000 metric tons) [Graph], Index Mundi, February 2, 2024. [Online]. Available: https://www.statista.com/statistics/881164/chile-wheat-consumption/